Understanding Consumer Preferences from Social Media Data
Bradley Taylor
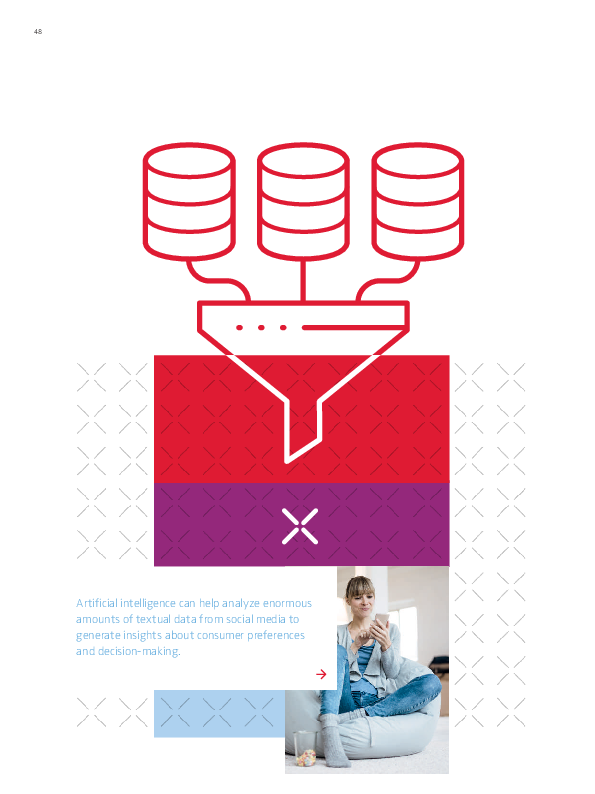
Consumers produce enormous amounts of textual data of product reviews online. Artificial intelligence (AI) can help analyze this data and generate insights about consumer preferences and decision-making. A GfK research project tested how we can use AI to learn consumer preferences and predict choices from publicly available social media and review data. The common AI tool “Word Embeddings” was used and has shown to be a powerful way to analyze the words people use. It helped reveal consumers’ preferred brands, favorite features and main benefits. Language biases uncovered by the analysis can indicate preferences. Compared to actual sales data from GfK panels, they fit reasonably within various categories. Especially when data volumes were large, the method produced very accurate results. By using free, widespread online data it is completely passive, without affecting respondents or leading them into ranking or answering questions they would otherwise not even have thought of. The analysis is fast to run and no fancy processing power is needed.

![[Translate to English:] [Translate to English:]](/fileadmin/_processed_/e/e/csm_hildebrand_intro_ai_vol_11_no_2_de_1e0479d1e9.png)
![[Translate to English:] [Translate to English:]](/fileadmin/_processed_/3/7/csm_2019_nim_mir_ai_de_res__Kapitel_1__2fa844ec2e.png)
![[Translate to English:] [Translate to English:]](/fileadmin/_processed_/f/1/csm_2019_nim_mir_ai_de_res__Kapitel_2__52310f2f29.png)
![[Translate to English:] [Translate to English:]](/fileadmin/_processed_/2/e/csm_2019_nim_mir_ai_de_res__Kapitel_3__b6b9b04ed2.png)
![[Translate to English:] [Translate to English:]](/fileadmin/_processed_/4/d/csm_2019_nim_mir_ai_de_res__Kapitel_4__c125a66154.png)
![[Translate to English:] [Translate to English:]](/fileadmin/_processed_/d/5/csm_2019_nim_mir_ai_de_res__Kapitel_5__5621369382.png)
![[Translate to English:] [Translate to English:]](/fileadmin/_processed_/c/2/csm_2019_nim_mir_ai_de_res__Kapitel_6__ce9e09e186.png)


